Navigation Map
- strategy (insurance, health, investments, finances);
- sustainable development (sales, employees, social responsibility, natural environment and ethics).
Corporate Governance
List of GRIs
List of GRIs
List of GRIs
List of GRIs
- About the report
- Results
- Comment on the financial results for 2021
- Major factors contributing to the consolidated financial result
- PZU Group’s income
- PZU Group’s claims paid and technical provisions
- PZU Group’s acquisition and administrative expenses
- Drivers and atypical events affecting the results
- PZU Group’s asset and liability structure
- Contribution made by the market segments to the consolidated result
- Issuer’s financial results – PZU (PAS)
- Supplementary information and notes
- 1. Introduction
- 2. Composition of PZU Group
- 3. Shareholder structure
- 4. Composition of the Management Board, Supervisory Board and PZU Group Directors
- 5. Key accounting policies, key estimates and judgments
- 5.1 Changes in accounting policies and estimates, errors from previous years
- 5.2 Amendments to the applied IFRS
- 5.3 Explanation of the difference between the 2020 annual consolidated financial statements and these consolidated financial statements
- 5.4 Consolidation principles
- 5.5 Measurement of transactions and balances denominated in foreign currencies and FX rates used
- 5.6 Purchase method
- 5.7 Classification of insurance contracts in accordance with IFRS 4
- 6. Segment reporting
- 7. Risk management
- 8. Equity management
- 9. Fair value
- 10. Gross written premiums
- 11. Revenue from commissions and fees
- 12. Interest income calculated using the effective interest rate
- 13. Other net investment income
- 14. Result on derecognition of financial instruments and investments
- 15. Movement in allowances for expected credit losses and impairment losses on financial instruments
- 16. Net movement in fair value of assets and liabilities measured at fair value
- 17. Other operating income
- 18. Claims, benefits and movement in technical provisions
- 19. Fee and commission expenses
- 20. Interest expenses
- 21. Acquisition costs
- 22. Administrative expenses
- 23. Employee expenses
- 24. Other operating expenses
- 25. Income tax
- 26. Earnings per share
- 27. Goodwill
- 28. Intangible assets
- 29. Other assets
- 30. Deferred acquisition cost
- 31. Property, plant and equipment
- 32. Investment property
- 33. Entities measured by the equity method
- 34. Loan receivables from clients
- 35. Financial derivatives
- 36. Investment financial assets, including assets securing liabilities
- 37. Receivables
- 38. Impairment of financial assets
- 39.Cash and cash equivalents
- 40. Equity attributable to equity holders of the parent
- 41. Technical provisions
- 42. Subordinated liabilities
- 43. Liabilities on the issue of own debt securities
- 44. Liabilities to banks
- 45. Liabilities to clients under deposits
- 46. Other liabilities
- 47. Provisions
- 48. Deferred income tax
- 49. Assets and liabilities held for sale
- 50. Lease
- 51. Assets securing receivables, liabilities and contingent liabilities
- 52. Contingent assets and liabilities
- 53. Offsetting financial assets and financial liabilities
- 54. Notes to the consolidated cash flow statement
- 55. Disputes
- 56. Transactions with related entities
- 57. Headcount
- 58. Other information
- Financial data 2021
- Financial data (2017-2021) Focus on: Results - check the highlights of the year!
- Comment on the financial results for 2021
- Market and business
- Capitals (IIRC)
- Strategy and outlook 2021+
- Risk management
- Ethics and governance
- Ethical foundations of doing business
- Application of corporate governance rules
- Financial statements control system
- Audit firm auditing the financial statements
- PZU’s share capital and shareholders
- Rules for amending PZU’s Articles of Association
- Shareholder Meeting and shareholder rights
- Supervisory Board and Management Board
- Compensation paid to members of supervisory and management bodies
- Diversity policy Focus on: Ethics and governance - check the highlights of the year!
- Shares and bonds

On 25 March 2021 the PZU Supervisory Board adopted a resolution to approve the PZU Group’s Capital and Dividend Policy for 2021-2024. The adopted policy is a continuation of the principles set forth in the PZU Group’s Capital and Dividend Policy for 2016-2020.
In accordance with the Policy, the PZU Group endeavors to do the following:
- manage capital effectively by optimizing the usage of capital from the Group’s perspective;
- maximize the rate of return on equity for the parent company’s shareholders, in particular by maintaining the level of security and retaining capital resources for strategic growth objectives through organic growth and acquisitions;
- ensure sufficient financial means to cover the Group’s liabilities to its clients.
The capital management policy rests on the following principles:
- manage the PZU Group’s capital (including excess capital) at the level of PZU;
- sustain target solvency ratios at the level of 200% for the PZU Group, PZU SA and PZU Życie SA (according to Solvency II);
- maintain the PZU Group’s financial leverage ratio at a level no higher than 25%;
- ensure funds for growth and acquisitions;
- maintain the financial conglomerate’s surplus own funds above the pertinent requirements for solvency;
- PZU will not issue any new shares for the duration of this Policy.
It is assumed that certain temporary deviations in the actual solvency ratio above or below the target level may occasionally occur.
As at the end of Q3 2021, the estimated solvency ratio (calculated according to the standard Solvency II equation) was 229%, a level above the average solvency ratio reported by insurance groups in Europe.
The Solvency II ratio for the PZU Group comprared to European insurers
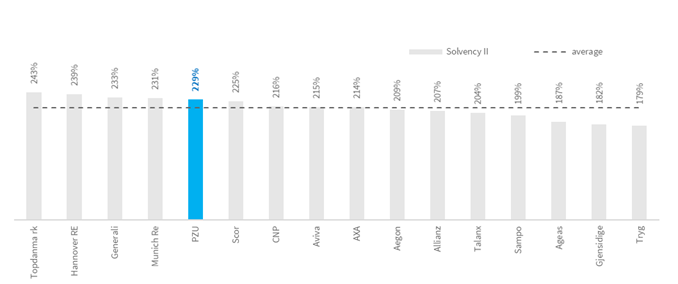
Source: Data taken from insurers’ reports as of Q3 2019 in the case of Ageas, Allianz, Aviva, AXA, CNP, Generali, Gjensidige, Munich Re, NN, Phoenix, RSA, Sampo, Scor, Talanx, Topdanmark, Tryg and as of H1 2019 in the case of the other insurers
In Bank Pekao and Alior Bank, the capital adequacy ratio and the Tier 1 ratio were computed on the basis of Regulation (EU) No 575/2013 of the European Parliament and of the Council of 26 June 2013 on prudential requirements for credit institutions and investment firms (CRR) and also the various types of risk identified in the Internal Capital Adequacy Assessment Process (ICAAP).
Solvency ratio
| Solvency ratio | 2020 | Q3 2021* |
| SCR | ||
| PZU Group | 236% | 229% |
| PZU | 268% | 256% |
| PZU Życie | 348% | 346% |
| MCR | ||
| PZU Group | 412% | 385% |
| PZU | 960% | 948% |
| PZU Życie | 772% | 769% |
| CRR | 2020 | 2021 |
| Pekao Group – total capital adequacy ratio | 19,2% | 16,9% |
| Tier 1 | 17,2% | 15,1% |
| Alior Bank Group – total capital adequacy ratio | 15,9% | 14,2% |
| Tier 1 | 13,5% | 12,5% |
*Q3 2021 has not been audited or reviewed by statutory auditor
Investor Relations Team
e-mail: IR@pzu.pl
Magdalena Komaracka, IR Director, tel. +48 (22) 582 22 93
Piotr Wiśniewski, IR Manager, tel. +48 (22) 582 26 23
Aleksandra Jakima-Moskwa, tel. +48 (22) 582 26 17
Aleksandra Dachowska, tel. +48 (22) 582 43 92
Piotr Wąsiewicz, tel. +48 (22) 582 41 95