PZU’s share price

PZU made its debut on the Warsaw Stock Exchange (WSE) on 12 May 2010. Since its floatation, it has been included in its most important index, namely WIG20, calculated on the basis of the portfolio value of the 20 largest and most heavily traded companies on WSE’s main market. PZU also belongs to the following Polish indices: WIG, WIG30, WIG-Poland, WIGdiv, WIG20 TR, WIG.MS-FIN, CEEplus and WIG ESG (sustainable development index) and the following international indices: MSCI Poland (emerging markets), Stoxx Europe 600 (developed markets) and FTSE Russel midcap index (developed markets).
Warsaw Stock Exchange indices
In 2021, the Polish blue chip index (WIG20) oscillated within a broad band between 1,877 and 2,472 points. The variance between these points was 595 points and was 299 points lower than that observed in the corresponding period of 2020 (894 points). In 2021, WIG20 went up by 14.3% y/y, or by 16.8% y/y if dividends are taken into account (WIG20 TR). The WIG broad market index gained 21.5% y/y. Small and medium cap indices also appreciated; sWIG80 and mWIG40 gained 24.6% and 33.1% y/y, respectively.
PZU’s share price
In 2021, the PZU stock prices went hand in hand with the main indices of the Warsaw Stock Exchange, which remained in an upward trend for the most part of the year. The correction came in Q4 2021 as fears regarding the development of the pandemic increased, and effects of the growing inflation and depreciation of the Polish zloty against euro and US dollar.
The decline in the PZU stock price in Q3 2021 shown in the graph below resulted from the deduction of the value of dividends paid out (PLN 3.5 per share). After the stock price was corrected for dividend, the total rate of return on PZU shares in 2021 was 20.1%, i.e. 3.3 p.p. above the main return index, WIG20 TR. In terms of price, PZU shares increased by 9.2% y/y in 2021.
PZU stock price versus WIG and WIG20
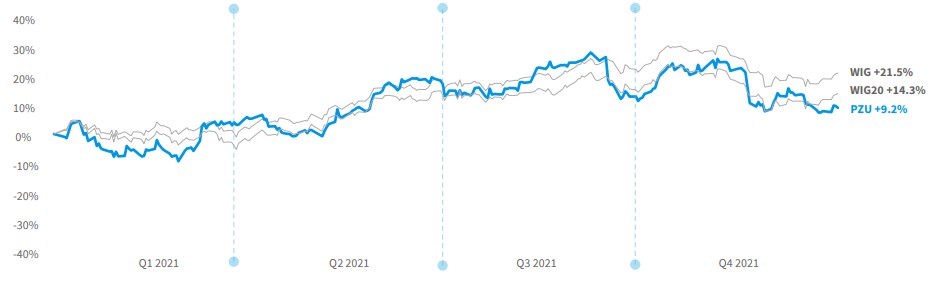
Source: www.infostrefa.com
Main factors affecting PZU’s stock price in 2021
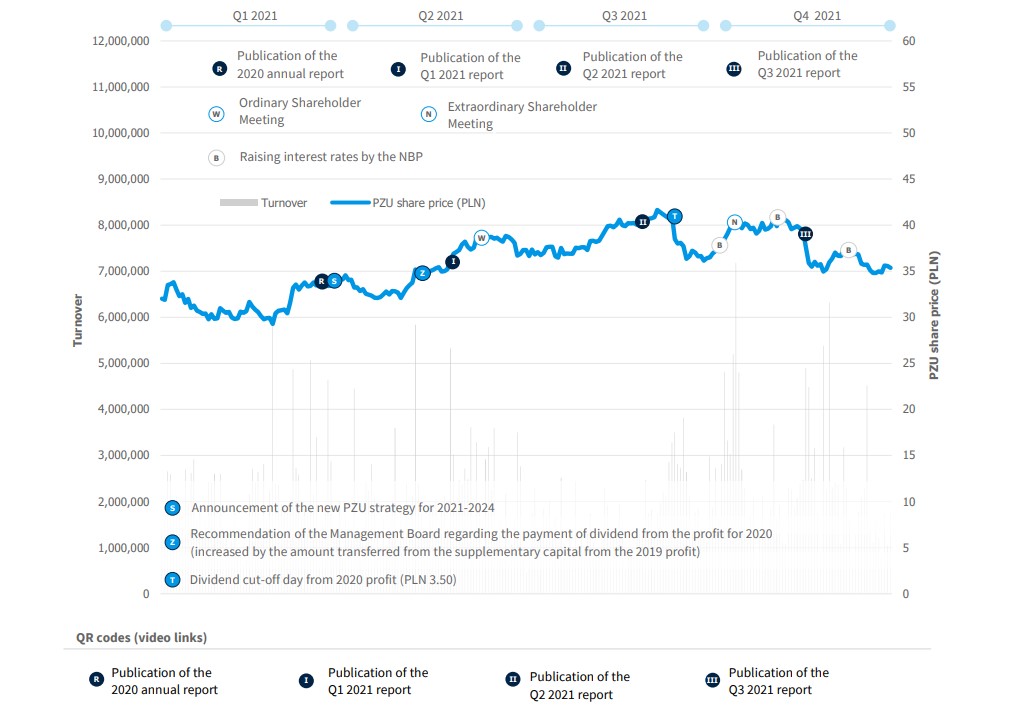
Source: www.infostrefa.com; PZU
QR codes (video links)

The maximum price per share of PZU stock in 2021 was PLN 41.65 (at closing prices) and the minimum price was PLN 29.27. In 2020, these prices were PLN 41.80 and PLN 20.55, respectively.
PZU’s min/max share prices (from May 2010 to 2021)
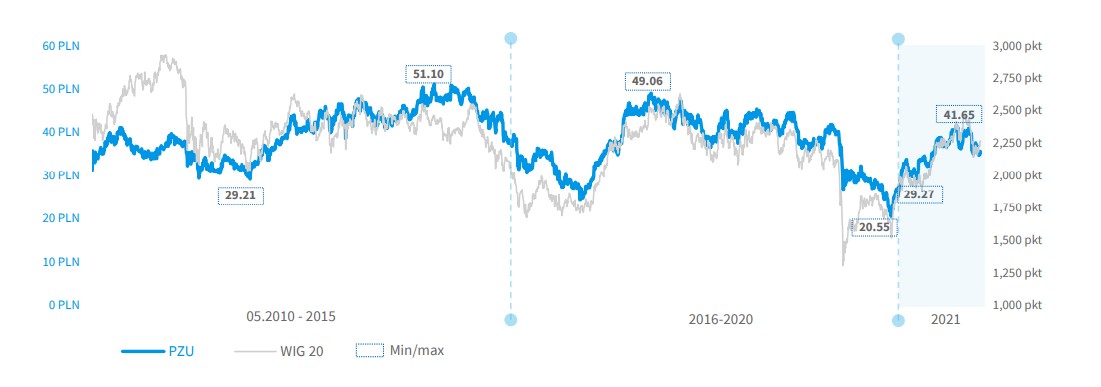
Source: www.infostrefa.com, www.msci.com
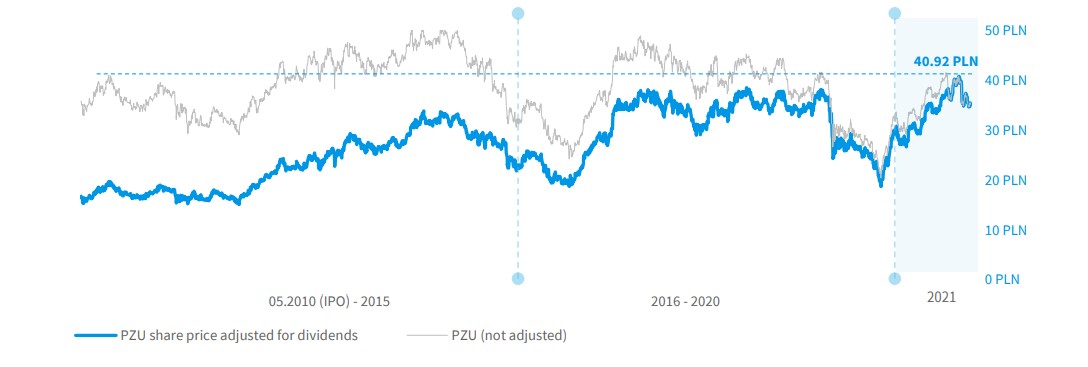
Considering the dividends paid1, on 4 November 2021, the PZU share price reached the historic high of PLN 40.92, beating the previous maximum from the end of January 2019 by 5.9%.
PZU’s share price adjusted for dividends paid from May 2010 to 2021
Capitalization
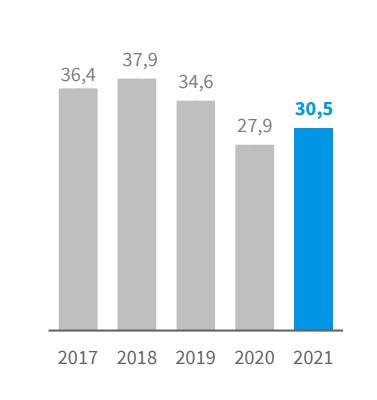
The stock market value (capitalization) of PZU at the end of 2021 was PLN 30.5 billion, placing it 9th (down 4 positions y/y) in terms of market price among Polish companies listed on the WSE. The lower position was associated mainly with the sudden increase in prices of banks listed on the WSE. PZU’s share in WSE’s total trading volume was 5.9% (6th place).
After adjustment of the PZU share price for the dividends paid out from IPO, the theoretical capitalization at the end of 2021 would amount to PLN 56.1 billion.
Capitalization of WSE in PLN bn (domestic and international companies)
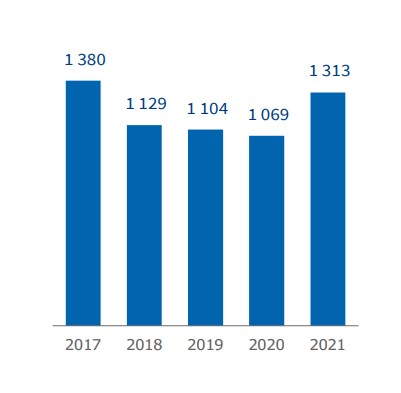
Capitalization of PZU in PLN bn
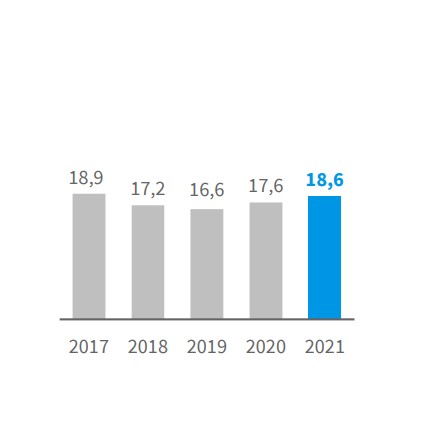
PZU share turnover in PLN bn
Source: www.infostrefa.com
Liquidity
In 2021, PZU’s shares were highly liquid. The average daily spread of PZU’s stock was 7 bps compared to the average spread of 16 bps for the 20 most liquid companies. The average turnover of PZU’s stock per session was PLN 73.9 million, i.e. up 6% y/y. The annual share turnover for the whole 2021 was PLN 18.6 billion, which was 61% of PZU’s total capitalization at the end of the year.
The largest daily share turnover was recorded during the session on 13 October 2021 (7.2 million shares worth PLN 287.7 million). The session closed without a change vs. the previous day price.
The largest daily share price increase was recorded during the session on 9 March 2021 (+5.23%). The share turnover was PLN 160.6 million.
Ratios (2017-2021)
| PZU’s stock* | 2017 | 2018 | 2019 | 2020 | 2021 |
| P/BV Share price / book value per share |
2,6x | 2,5x | 2,1x | 1,5x | 1,8x |
| BVPS (PLN) Book value per share |
16,3 | 17,3 | 18,7 | 21,7 | 3,9 |
| P/E Share price / net earnings per share |
12,6x | 11,8x | 10,5x | 14,6x | 9,2x |
| EPS (PLN) Net profit (loss) / number of shares |
3,4 | 3,7 | 3,8 | 2,2 | 3,9 |
* Calculation based on the PZU Group’s data (according to IFRS); price per share and book value at yearend; net profit for 12 months; number of PZU shares: 863,523,000
Statistics concerning the PZU share price adjusted for dividends paid
| Statistics concerning the PZU share price adjusted for dividends paid | 2017 | 2018 | 2019 | 2020 | 2021 |
| Closing price on the last trading session of the year (PLN) | 62,94 | 67,18 | 66,11 | 58,44 | 64,93 |
| Capitalization at the end of the period (PLN m) | 54 354 | 58 015 | 57 091 | 50 468 | 56 072 |
Source: www.infostrefa.com
PZU’s stocks-related statistics
| PZU’s stock-related statistics | 2017 | 2018 | 2019 | 2020 | 2021 |
| Maximum price (PLN) | 49,06 | 47,34 | 45,39 | 41,8 | 41,65 |
| Minimum price (PLN) | 32,82 | 36,31 | 35,79 | 20,55 | 29,27 |
| Closing price on the last trading session of the year (PLN) | 42,16 | 43,9 | 40,03 | 32,36 | 35,35 |
| Average session price (PLN) | 42,53 | 41,48 | 40,61 | 30,06 | 35,86 |
| Trading volume (PLN m) | 18 902 | 17 183 | 16 620 | 17 588 | 18 565 |
| Average turnover per session (PLN m) | 75,6 | 69,6 | 67,0 | 69,8 | 73,9 |
| Number of transactions (units) | 985 515 | 926 486 | 928 493 | 1 523 449 | 1 353 198 |
| Average number of trades per session | 3 942 | 3 751 | 3 744 | 6 045 | 5 391 |
| Trading volume (units) | 448 832 864 | 415 380 500 | 408 999 167 | 595 296 291 | 517 939 229 |
| Average trading volume per session (shares) | 1 795 331 | 1 681 702 | 1 649 190 | 2 362 287 | 2 063 503 |
Source: www.infostrefa.com
PZU’s valuation compared to the peer group (2021)
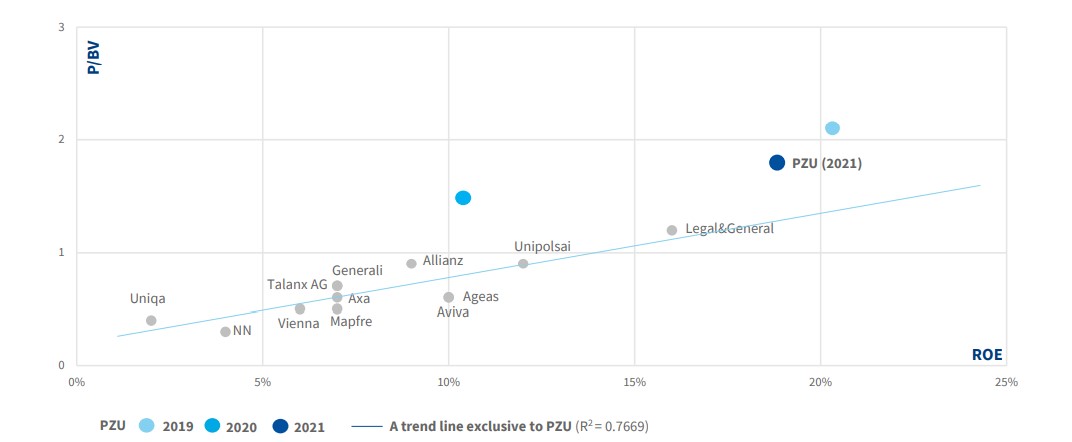
Source: PZU (2019, 2020, 2021) – reported data; other companies – 2021 annual forecasts (Bloomberg); PZU share prices at year-end
1 In accordance with the methodology applied by Stooq (http://stooq.pl/pomoc/?q=9&s=pzu)