


[GRI 307-1]
In 2021, the PZU Group recorded no breaches of any environmental laws or regulations and incurred no environmental penalties.
1 www3.weforum.org/docs/WEF_The_Global_Risks_Report_2022.pdf
Energy consumption
Energy consumption edged up slightly by 2.3% in 2021 in the PZU Group’s major companies, i.e. PZU and PZU Życie. The total consumption of energy purchased and produced, representing 53% of total energy consumption dipped by 2.1%. This was chiefly caused by the pandemic and the resulting reduction of the use of properties by the Group companies, and a number of efforts focused on reduction of raw material and energy consumption, and thermal modernization of the properties, modernization of heat sources and replacement of lighting. In turn, fuel consumption edged up 7.7% y/y, especially natural gas and petrol.
PZU and PZU Życie’s total consumption of energy from non-renewable fuels
| Table A' | PZU | PZU Życie | ||
| 2020 | 2021 | 2020 | 2021 | |
| Natural gas [GJ]1) | 20 624 | 24 083 | 10 305 | 11 089 |
| Heating oil [GJ]2) | 2 451 | 2 173 | 338 | 419 |
| Petrol [GJ]3) | 55 186 | 58 297 | 19 355 | 19 617 |
| Diesel oil [GJ]4) | 270 | 1 281 | 118 | 28 |
| Total consumption [GJ] | 78 531 | 85 835 | 30 115 | 31 153 |
1) Calorific value of natural gas at 36.54 MJ/m3 in 2021 and 2020
2) Calorific value of heating oil at 43 MJ/kg in 2021 and 2020
3) Calorific value of petrol at 44.3 MJ/kg in 2021 and 2020
4) Calorific value of Diesel oil at 43 MJ/kg in 2021 and 2020 rok
Total consumption of energy purchased in PZU and PZU Życie
| Table B' | PZU | PZU Życie | ||
| 2020 | 2021 | 2020 | 2021 | |
| Electricity [GJ] | 51 063 | 47 994 | 14 555 | 14 758 |
| - including energy from renewable sources | 42 361 | 39 729 | 9 056 | 9 364 |
| - share in electricity (%) | 83% | 83% | 62% | 63% |
| - including energy from non-renewable sources | 8 702 | 8 265 | 5 499 | 5 394 |
| Thermal energy [GJ] | 50 741 | 50 706 | 19 634 | 19 738 |
| Total consumption [GJ] | 101 804 | 98 700 | 34 189 | 34 496 |
PZU and PZU Życie’s total consumption of energy from non-renewable fuels and purchased energy
| Table A' + B' | PZU | PZU Życie | ||
| 2020 | 2021 | 2020 | 2021 | |
| Total energy consumption (GJ) | 180 336 | 184 536 | 64 304 | 65 649 |
Electricity from renewable sources
In 2021, 83% of the electricity contracted and purchased by PZU and 63% of the electricity purchased by PZU Życie came from renewable sources (RES)2. In locations covered by direct contracts with energy companies, 100% of the purchased electricity originated from renewable sources.
Additionally, in 2021, in 5 properties PZU and PZU Życie installed photovoltaic panels – their total power was 75.48 kWp3.
The use of electricity from RES, in addition to the economic aspect, has an important impact on climate protection through reduction of CO2 and other greenhouse gas emissions. It leads to reduction of scope 2 emissions through reducing the demand for energy and, as a consequence, reduction of the use of fossil fuels for production of energy from high-emission sources. The cost savings regarding the electricity consumed for 25 properties in which photovoltaic panels were installed are in the range of 22%.
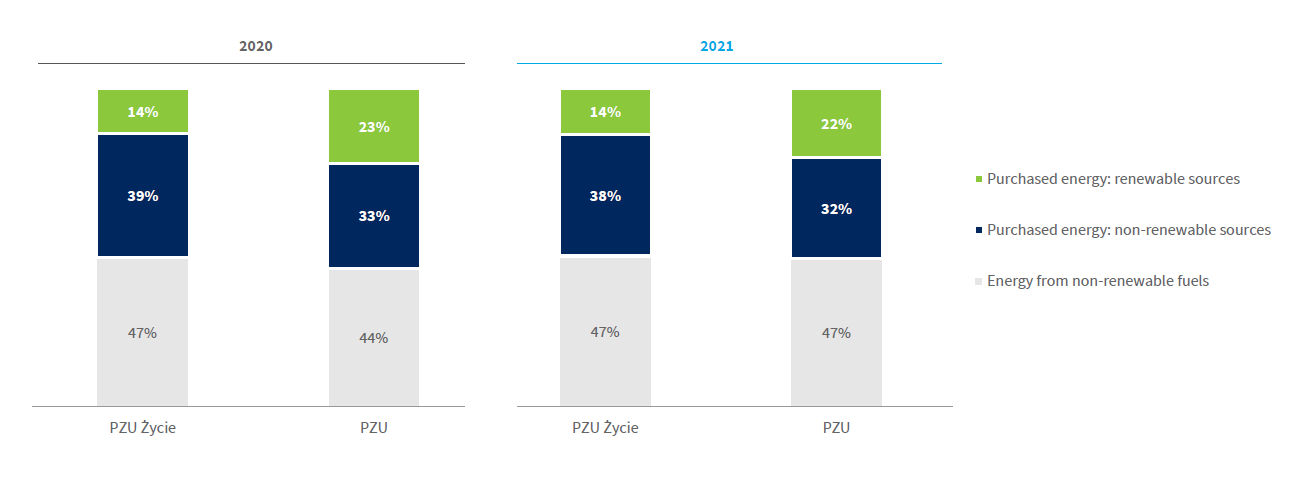
Thanks to the purchase of electricity with certificates of origin by PZU and PZU Życie, its share in total energy consumption (energy purchased, produced and energy from fuels) by these companies amounted to 22% and 14%, respectively. In the years to come, further use of RES and increase in the share of green energy, subject to its availability in the market, is planned.
In 2021, consumption of energy, both produced and purchased, increased by 0.6% in the entire PZU Group. The key drivers of the consumption growth included: higher consumption of natural gas (+20% y/y) and consumption of thermal energy (+2% y/y), while the key offsetting factor was the decreasing consumption of diesel fuel and gasoline. In the second year of the coronavirus pandemic, after the hard lockdown period in 2020 and with absence thereof for the most part of 2021, utilization of space and fleet in most Group companies stabilized or was growing, which caused a slight increase in the consumption of energy purchased and energy from fuels. On the other hand, the companies continued to focus on optimizing and reducing their consumption of fuel, electricity and thermal energy. The consumption of electricity was driven by a dynamic development of the PZU Zdrowie Group, with an increasing number of health care centers, a significantly higher utilization of the centers and longer working hours in 2021 as compared to 2020.
The conversion of fuels into energy for all Group companies is based on the calorific values published by KOBIZE (National Centre for Emissions Management).
The share of renewable sources in total energy consumption at PZU and PZU Życie
PZU Group’s total consumption of energy from non-renewable fuels
| Table A | 2020 | 2021 |
| Natural gas [GJ]1) | 144 208 | 172 811 |
| Heating oil [GJ]2) | 13 554 | 16 304 |
| Petrol [GJ]3) | 174 859 | 172 764 |
| Diesel oil [GJ]4) | 46 954 | 16 119 |
| Total consumption [GJ] | 379 574 | 377 999 |
1) Calorific value of natural gas at 36.54 MJ/m3 in 2021 and 2020
2) Calorific value of heating oil at 43 MJ/kg in 2021 and 2020
3) Calorific value of petrol at 44.3 MJ/kg in 2021 and 2020
4) Calorific value of Diesel oil at 43 MJ/kg in 2021 and 2020 rok
[GRI 302-1]
PZU Group’s total consumption of purchased and produced energy
| Table B | 2020 | 2021 |
| Electricity [GJ] | 418 405 | 415 719 |
| Thermal energy [GJ] | 490 591* | 502 710 |
| Total consumption [GJ] | 908 996 | 918 429 |
* Consumption of thermal energy for 2020 was adjusted by 277,231 GJ after the Bank Pekao Group started estimating its consumption
PZU Group’s total consumption of energy from non-renewable fuels and purchased and produced energy
| Table A + B | 2020 | 2021 |
| Total energy consumption (GJ) | 1 288 570 | 1 296 427 |
Energy savings
In 2021, the PZU and PZU Życie Real Estate Department continued its endeavors focused on reducing the consumption of heat and electricity, the emissions of gases in real properties owned or used by PZU and PZU Życie. Completed activities:
- thermal modernization of 4 PZU and PZU Życie properties was carried out;
- power compensators were installed in 4 properties;
- the contracted power in 1 property was reduced;
- internal LED lighting was installed in 55 properties;
- 7 image walls with LED lighting were installed;
- the heating installation or heating source in 1 property was modernized and modified and thermal power in 5 properties was reduced;
- 6 depleted heating boilers were replaced with modern and highly efficient devices, which conserve electricity and heat, offer an option to adjust their operation to weather conditions (through weather controllers) and reduce emission of gases to the atmosphere;
- 18 air conditioning devices using the environmentally friendly refrigerant R32 were installed.
- 5 photovoltaic installations with the total capacity of 75.48 kWp was installed.
In 2021, Bank Pekao continued to implement environment-friendly solutions, with special focus on those which limit electricity consumption and reduce the negative impact on the environment. These include primarily:
- implementation of the energy-saving LED lighting technology;
- optimization of energy consumption (reduction of the so-called contracted power);
- replacement of obsolete UPS devices with new ones with higher maximum efficiency;
- liquidation of redundant back-up power supply;
- installation of air conditioning systems with improved indicators, with special focus on solutions in the highest energy efficiency classes;
- replacement of air conditioning systems using refrigerants that have adverse impact on the environment with devices using a mix of environment-friendly gases;
- analyses leading to installation of devices compensating the reactive power (leading to elimination of unnecessary energy expenditures);
- switching electronic devices in the evening to standby mode.
In comprehensive modernizations of its properties the Bank uses modern solutions, e.g. energy-saving LED lighting systems or faucet aerators, leading to reduction of water consumption.
Company cars in the Bank’s fleet are gradually replaced with models that emit less exhaust gases. Currently, the Bank is in the process of replacing a significant portion (approx. 75%) of its fleet with new cars, which meet the Euro 6DG emission standard.
Alior Bank has implemented a number of electricity saving initiatives. Shared space in the head offices (corridors, bathrooms, kitchens) have been equipped with movement and presence sensors, which turn the light on and off automatically. The system also operates in some of the premises at the head office in Warsaw as well as in branches adapted to the new branch format. In 2021, as a result of the changed structure of the fleet and increased percentage of gas-fueled cars, the consumption of diesel fuel fell significantly. LPG offers much lower CO2 emissions and contains no benzene or lead and does not produce any particulates, thus significantly reducing the amount of pollution emitted into the atmosphere.
Armatura Kraków has implemented solutions to reduce the consumption of gas. By using new double-channel thermoregulators to shorten the casting cycle of heaters by 15%, it was able to reduce gas consumption in the preheating furnaces of the casting machines by 15%, which translated into savings of 1,013.9 m³ of gas in 2021. A permanent shortening of the machine’s casting cycle by 4% through an upgrade of casting molds resulted in saving 71.9 m³ of gas used in the preheating furnace in 2021.
In an effort to increase the share of energy from renewable sources, Armatura Kraków signed an agreement with Kompania Solarna Sp. z o.o. and commenced the work on building a photovoltaic farm with the capacity of nearly 1,800,000 Wp by the end of 2022. This will allow it to obtain energy from renewable sources and reduce its carbon footprint.
In addition, Armatura Kraków obtained white certificates from ERA, which confirm the modernizations aiming at improving the energy efficiency and resulting in energy savings. The value of the obtained Energy Efficiency Certificate 705.641 toe, i.e. 29,544 GJ on average per annum over no less than the next 7 years. The project was completed in October 2020, with the resulting benefits becoming fully visible in 2021, and will have a positive environmental impact for years to come. This will translate into CO2e emission reductions by 1.6 thousand tons CO2 going forward.
2 RES - total resources used for production of electricity and heat whose long-term use does not cause a significant deficit or which are renewed over a short time. These sources include: wind power, solar radiation power, geothermal power, hydropower, wave power, tidal power, salt gradient and flow power, power obtained from biomass, biogas and biofuels
3 kWp - defines the efficiency that can be achieved by photovoltaic panels if they work in standard measurement conditions – how much electricity (1 kWh) the given panel or the whole photovoltaic installation is able to produce
Carbon footprint of the PZU Group
In its strategy for 2021-2024, the PZU Group declared that it would be an active participant of energy transition and by 2024 it plans to fully utilize energy from renewable sources and offset emissions from own sources. Within the time horizon of the strategy, PZU and PZU Życie should become climate-neutral in scope 1 and 2.
In order to monitor this commitment, the PZU Group has been measuring its direct and indirect emissions since 2018. Every year, the measurement process is improved and its scope extended. The calculation of 2020 and 2021 emissions was for the first time subject to an independent review by a certified reviewer.
In 2021 the PZU Group continued multidirectional measures aimed at reduction of its emissions in scope 1 and 2, among others through purchase of energy from renewable sources, installing own installations for renewable energy production (photovoltaic panels) and purchase of energy from suppliers characterized by lower emission rates.
According to the commitment stated in the ESG Strategy, in 2021, PZU SA and PZU Życie SA for the first time offset the CO2 emissions to which they contributed in 2020. The offset was made by purchasing Carbon Dioxide Units (JDW) offered by State Forests. Overall, the Companies purchased enough Carbon Dioxide Units to offset nearly 17 thousand tons of CO2 and the funds from their purchase – as indicated – will be used by State Forests to plant a forest in areas damaged by a cyclone in 2017. The 2021 emissions are expected to be offset in 2022. JDW were not included in the verification.
The PZU Group was placed on the list of climate leaders for the second time – the ranking of Polish companies with the biggest reduction of greenhouse gases (GHG) organized by “Forbes Polska” and Statista, company specializing in market and consumer data. The aim of the ranking is to distinguish companies that are the most aware of their challenges regarding greenhouse gas emissions, showing at the same time respect for the environment.
Below are the data on the total direct and indirect emissions for the whole PZU Group and for the main insurance companies: PZU and PZU Życie. The calculations of the carbon footprint were made in accordance with the international GHG Protocol Corporate Accounting and Reporting Standard. 2018 was selected as the base year. To illustrate the impact of these measures on the Group’s total emissions, the data on scope 2 (indirect emissions) are enriched by a calculation of the emissions using the market-based method, which more fully reflects the impact of the actions taken, thanks to the use of emission rates specific to respective electricity sellers.
Emissions (scope 1) 2021 vs. 2020
Total direct emissions in scope 1 in the PZU Group reached 25.1 thousand tons of CO2e, compared to 25.8 thousand tons of CO2e in 2020, down 2.7% (-0.7 thousand tons y/y). The slower decrease as compared to 2020 was caused by a stable or higher utilization of the companies’ properties and fleets, which increased consumption of fuel. Fuel emissions declined 2.6% y/y (-0.6 thous. tons of CO2e, with a noticeable decrease in emissions from combustion of gasoline and diesel fuel and an increase in emission from natural gas and heating oil. The latter were adversely affected by low temperatures in early 2021. Numerous initiatives aiming to reduce scope 1 emissions were continued; among others the installations were modernized and heating boilers replaced. In PZU, PZU Życie and both PZU Group banks, the cars in the own fleet were replaced with models producing lower emissions. Additionally, already in previous years PZU and PZU Życie began installing air conditioning devices containing new environmentally friendly refrigerant R32 which has a third of the GWP (greenhouse effect potential) compared to standard refrigerants. In 2021, 18 such air conditioning devices were installed. As a result, refrigerant-related emissions fell in 2021 by 4.6% (-56 tons y/y).
Total direct emissions (scope 1) in the PZU Group
| CO2e 1) (in tons) | 2018 | 2020 | 2021 | |||||||||
| PZU Group | PZU | PZU Życie | Other ompanies | PZU Group | PZU | PZU Życie | Other ompanies | PZU Group | PZU | PZU Życie | Other ompanies | |
| Total | 31 400 | 9 229 | 2 322 | 19 849 | 25 794 | 5 416 | 2 122 | 18 255 | 25 096 | 6 144 | 2 092 | 16 860 |
| Refrigerants | 1 945 | 1 919 | 26 | - | 1 213 | 249 | 177 | 787 | 1 156 | 515 | 86 | 556 |
| Fuels 2) | 29 454 | 7 310 | 2 295 | 19 849 | 24 580 | 5 167 | 1 945 | 17 468 | 23 940 | 5 629 | 2 006 | 16 305 |
1) CO2e - carbon dioxide equivalent, universal unit used for measurement of greenhouse gas emissions which reflects their different global warming factor. It defines the concentration of carbon dioxide whose emission into the atmosphere would have identical impact as the concentration of a comparable greenhouse gas.
2) The PZU Group collects data on the consumption of the following fuels: petrol, Diesel oil, natural gas and heating oil
Emissions (scope 1) 2021 vs. 2018
Total scope 1 emissions dropped 20.1% relative to the base year (2018), including emissions associated with refrigerant leakages were 40.5% lower, despite including additional PZU Group companies in the reporting in 20204, and emissions associated with fuels dropped by 18.7% compared to the base year. As in the report for previous years, the calculations were made for the facilities where consumptions are measured. In the case of consumption of natural gas by PZU and PZU Życie (total), they pertain to approx. 90% of the surface of the properties used by these companies.
Compared with the previously reported Scope 2 data, both 2020 and 2018 (base year) were adjusted due to the fact that the Bank Pekao Group started the measurement of heat consumption and its estimation where it is not measured. This change translated to an adjustment of the Group’s Scope 2 emissions by 26.8 thous. tons in 2020 and 34.0 thous. tons in 2018 but did not cause recalculation of emissions for PZU or PZU Życie. The base year calculations were revised because the change in the energy consumption methodology in the Pekao Group resulted in identification of additional emissions, whose size proved to be material and required the revision.
Emissions (scope 2 – market-based) 2021 vs. 2020
Market-based indirect scope 2 emissions reached 101.9 thousand tons of CO2e in 2021 compared to 106.5 thousand tons in 2020, which signifies a decrease by 3.9% y/y (-4.6 thous. tons). Electricity-related emissions dropped by 9.7% (-5.8 thous. tons), while those related to thermal energy increased by 2.5% (+1.1 thous. tons).
The decrease in electricity-related emissions was associated mainly with the electricity purchased (which contributed -5.4 thous. tons), and more specifically: the fact that PZU and PZU Życie purchased certified energy from lower-emission suppliers, Poland’s declining emission ratio and lower consumption of electricity in the Group (contribution of -0.4 thous. tons).
Emissions associated with heat increased by 2.5% (+1.1 thousand tons y/y), mainly in connection with the higher use of thermal energy in Poland.
Additionally, the above trends were driven by the reduction initiatives undertaken by the Group in the area of own properties and such efforts as, for example, thermal modernizations, installation of power compensators, replacement of lighting with energy-saving solutions, and optimization of energy consumption through reduction of contracted power. Consumption of electricity and heat remained lower due to the fact that the epidemic regime was still in effect in Poland and remote and/or hybrid forms of working continued; in the case of PZU Health Group, the utilization of facilities increased significantly in 2021 relative to 2020 when strict lockdowns were in effect.
Emissions (scope 2 – market-based) 2021 vs. 2018
Total scope 2 emissions calculated using the market-based method dropped 39.6% relative to the base year (2018), including emissions associated with supply of heat were 24.8% lower, and emissions associated with electricity dropped by 48.5% compared to the base year. As in the 2019 report, the calculations were made for the facilities where consumptions are measured. In the case of PZU and PZU Życie (total) they pertain to approx. 90% of the surface of the properties used by these companies for electricity consumption and approx. 80% for heat consumption.
[GRI 305-2]
Total indirect emissions (scope 2) in the PZU Group – market-based method
| CO2e (in tons) |
2018 | 2020 | 2021 | |||||||||
| PZU Group | PZU | PZU Życie | Other ompanies | PZU Group | PZU | PZU Życie | Other ompanies | PZU Group | PZU | PZU Życie | Other ompanies | |
| Total | 168 573 | 21 760 | 7 324 | 139 490 | 106 543 | 6 535 | 2 930 | 97 077 | 101 900 | 6 390 | 2 882 | 92 628 |
| Supplied thermal energy | 63 665 | 8 755 | 3 789 | 51 122 | 46 755 | 4 897 | 1 895 | 39 964 | 47 904 | 4 893 | 1 905 | 41 106 |
| Supplied electricity – market-based | 104 908 | 13 005 | 3 535 | 88 368 | 59 788 | 1 639 | 1 036 | 57 114 | 53 996 | 1 497 | 977 | 51 522 |
Emissions (scope 2 – location-based) 2021 vs. 2020
Location-based indirect scope 2 emissions reached 121.7 thousand tons of CO2e in 2021 compared to 123.9 thousand tons in 2020, which signifies a decrease by 1.8% y/y (-2.2 thousand tons). The decrease is less pronounced than in the case of the market-based method, because the location-based method does not take into account certificates of origin or differences in the emission rates of individual suppliers.
The reduction of scope 2 emissions measured with the location-based method was attributable to reduced emissions associated with the lower consumption of electricity (-3.3 thousand tons CO2e) and increased emissions related to the higher consumption of thermal energy (+1.1 thousand tons CO2e). In the case of electricity, lower emission levels resulted, to a greater extent, from Poland’s lower emission ratios (contribution of -2.8 thous. tons) than from lower energy consumption (contribution of -0.5 thous. tons).
Emissions (scope 2 – location-based) 2021 vs. 2018
Total scope 2 emissions calculated using the location-based method dropped 22.0% relative to the base year (2018), including emissions associated with supply of heat were 24.8% lower, and emissions associated with electricity dropped by 20.1% compared to the base year. The base year was adjusted by 34.0 thousand tons CO2e, as described above.
[GRI 305-2]
Total indirect emissions (scope 2) in the PZU Group – location-based method
| CO2e (in tons) |
2018 | 2020 | 2021 | |||||||||
| PZU Group | PZU | PZU Życie | Other ompanies | PZU Group | PZU | PZU Życie | Other ompanies | PZU Group | PZU | PZU Życie | Other ompanies | |
| Total | 156 091 | 21 098 | 7 109 | 127 884 | 123 881 | 14 512 | 4 636 | 104 734 | 121 709 | 13 586 | 4 578 | 103 545 |
| Supplied thermal energy | 63 665 | 8 755 | 3 789 | 51 121 | 46 755 | 4 897 | 1 895 | 39 964 | 47 904 | 4 893 | 1 905 | 41 106 |
| Supplied electricity – location-based | 92 426 | 12 343 | 3 320 | 76 763 | 77 126 | 9 615 | 2 741 | 64 770 | 73 804 | 8 693 | 2 673 | 62 439 |
Emissions 2021 (scope) – location-based vs. market-based
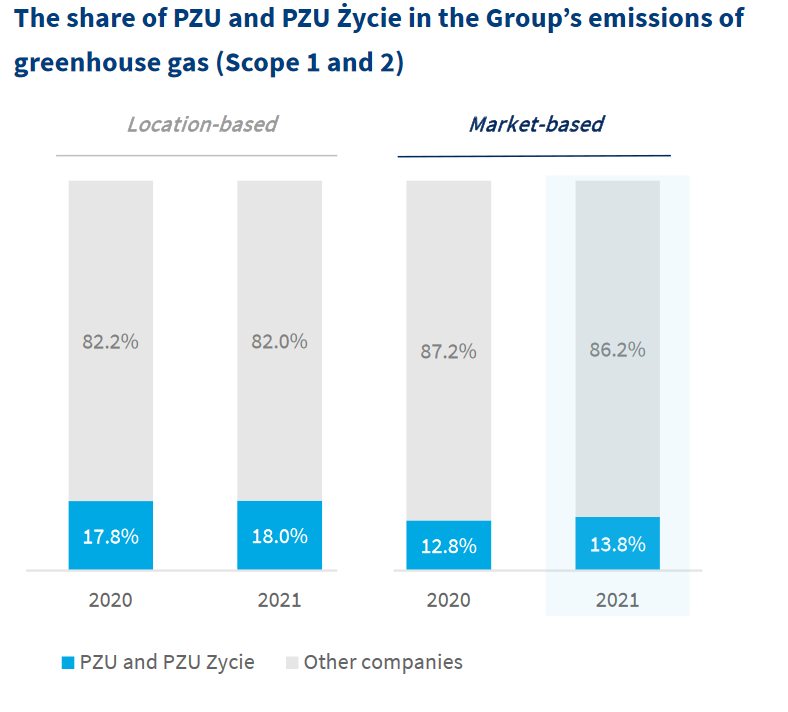
Comparing the results obtained using the location-based and the market-based method, one can see the management approach to selection of suppliers due to emission rates and purchase of energy from renewable sources. In PZU and PZU Życie, total scope 2 emissions (calculated using the market-based method) in 2021 stood at 9.3 thousand tons CO2e, which is two times lower than the result achieved without taking into account the emission rates of the suppliers and the energy from RES (location-based). The share of PZU and PZU Życie in the Group’s total scope 1 and 2 emissions (calculated using the market-based method) was 13.8% in 2021.
Emissions (scope 3) 2021 vs. 2020
Scope 3 (indirect) emissions in categories 1, 3, 5 and 6 (listed in the table above)5 by the PZU Group reached 24.5 thousand tons of CO2e compared to 18.1 thousand tons in 2020 (+35.3% y/y or +6.4 thousand tons). The increase occurred predominantly in emissions related to energy and fuels in the value chain and resulted mainly from increased emission ratios, as published by DEFRA (for electricity from 0.11 to 0.17 kg CO2e/kWh), since the fuel consumption levels were similar. Also emissions associated with purchased raw materials and services (in particular with the consumption of paper) were lower.
Emissions (scope 3) 2021 vs. 2018
Scope 3 (indirect) emissions in selected categories dropped by 1.8%, or 436 tons relative to the base year (2018). The largest contributor to the change was the decrease in emissions related to the purchased raw materials and services (paper, water, waste treatment). The increase versus the base year resulted mainly from emissions associated with energy and fuels not covered by scope 1 and 2.
[GRI 305-3]
Total other indirect emissions (scope 3) in the PZU Group
| CO2e (in tons) |
2018 | 2020 | 2021 | |||||||||
| PZU Group | PZU | PZU Życie | Other ompanies | PZU Group | PZU | PZU Życie | Other ompanies | PZU Group | PZU | PZU Życie | Other ompanies | |
| Total | 24 936 | 4 372 | 1 293 | 19 270 | 18 103 | 1 734 | 708 | 15 660 | 24 500 | 2 022 | 850 | 21 628 |
| Emissions associated with energy and fuels not covered by scope 1 and 2 | 22 944 | 3 977 | 1 130 | 17 836 | 16 758 | 1 562 | 627 | 14 569 | 23 721 | 1 904 | 777 | 21 041 |
| Raw materials and services purchased (paper, water, sewage treatment) | 1 736 | 202 | 99 | 1 434 | 1 281 | 142 | 72 | 1 067 | 743 | 104 | 64 | 575 |
| Waste generated as a result of the operations | 2 | 1 | 1 | - | 5 | 3 | 2 | - | 7 | 5 | 2 | - |
| Business travel (airplane, train, taxi) | 255 | 192 | 63 | 59 | 27 | 8 | 24 | 29 | 9 | 7 | 12 | |
Calculation methodology
For the calculation of emissions in accordance with the GHG Protocol standard, for fuels, electricity (consumed in Poland), emission indicators or data from the National Center for Emissions Balancing and Management were used, while for heat (consumed in Poland) the indicator of the Energy Regulatory Office was used (based on the publication “Heating Energy in Numbers 2019”). The emission indicators for electricity consumed in foreign companies for 2021 were obtained from data published by the European Environment Agency (in previous years from the International Energy Agency), while those for heat energy were obtained from the UK Government’s Department of the Environment, Food and Rural Affairs (DEFRA) database. For scope 2 emissions calculated according to the location-based method, average emission ratios for the respective countries were used. The indicators for electricity from a specific supplier (market-based method) came from the websites of energy sellers (among others Enea, Energa, PGE, Innogy Polska, Tauron Sprzedaż, Tauron Sprzedaż GZE, Tauron Polska Energia, PKN Orlen, ENGIE Zielona Energia).
The emission indicators for energy in the scope of WTT (well to tank) (scope 3), business trips, purchased raw materials and services, waste management and GWP for refrigerants were obtained from the DEFRA database. No biogenic greenhouse gas emissions were identified.
The following data sources were used: data on fuel, electricity and heat consumption came from the invoices for the facilities where the consumption is measured (on the basis of invoices in PZU and PZU Życie; this pertained to electricity in over 90% facilities, for natural gas in over 90% facilities and for heat in over 80% facilities). Consumption of raw materials, refrigerants, waste volumes and business travel was determined on the basis of internal registers. Data that are not collected from the remaining companies were marked in the table with a dash.
The greenhouse gas described in the emission indicators for fuels, electricity and heat in Poland is CO2. The other indicators included CO2, CH4 and N2O emissions as well as refrigerant gases. The volume of emissions released by each company was consolidated at the PZU Group level according to the operational control criterion.
Below are presented the greenhouse gas emissions taking into account the consolidated assets and number of employees.
[GRI 305-4]
Intensity of greenhouse gas emissions
| Intensity of greenhouse gas emissions | 2018 | 2020 | 2021 |
| Number of employees | 41 742 | 39 857 | 38 666 |
| Consolidated assets (PLN million) | 328 554 | 378 974 | 402 129 |
| Emissions (scope 1 and 2 using the market-based method) per employee (tons CO2e / employee) | 4,8 | 3,3 | 3,3 |
| Emissions (scope 1 and 2 using the market-based method) per million of consolidated assets (tons CO2e / 1 million of consolidated assets) | 0,61 | 0,35 | 0,32 |
As a result of the actions taken to reduce emission rates, reduce energy and fuel consumption and emission rates in Poland, the intensity of scope 1 and 2 emissions using the market-based method per employee dropped from 4.79 in the base year and 3.32 in 2020 to 3.28 tons CO2e in 2021. Emissions per million zloty of consolidated assets dropped from 0.61 in the base year and 0.35 in 2019 to 0.32 tons CO2e in 2020.
[GRI 305-5]
Reduction of greenhouse gas emissions
The PZU Group, in particular PZU and PZU Życie, reduced emissions by 9.9 thousand tons CO2e in 2021 through purchase of energy with certificates of origin. The reduction was recorded in scope 2 and calculated as the sum of products of the purchased electricity from individual suppliers multiplied by appropriate emission indicators shown for these sellers.
PZU and PZU Życie took actions aimed at reducing scope 1 greenhouse gas emissions associated with combustion of fuels. To this effect, in 2021, the companies expanded their fleet by 32 hybrid cars. It is estimates that this will translate into reduction of the annual CO2e emissions by 56 tons6 in 2022. As a result of replacing outdated gas boilers and thermomodernisation of buildings, the reduction of CO2 emissions is estimated at 42 tonnes of CO2 in 2021.
In 2022, actions will be continued that will contribute to further reduction of indirect emissions:
- development of the sustainable business travel model,
- use of the services of transport companies with electric and hybrid fleets,
- cooperation with hotels that offer high environmental standards. A list of features of “sustainable hotels” was prepared, setting out the environmental standards that a hotel should meet. They will be used as an eligibility factor for the next tender procedure for hotels, with which PZU will sign master agreements.
According to the commitment made in the ESG Strategy, PZU SA and PZU Życie SA carried out the first offset of the CO2 emissions to which they contributed in 2020. The offset was made by purchasing Carbon Dioxide Units (JDW) offered by State Forests. Overall, the Companies purchased enough Carbon Dioxide Units to offset nearly 17 thousand tons of CO2 and the funds from their purchase – as indicated – will be used by State Forests to plant a forest in areas damaged by a cyclone in 2017. In the fall of 2021, State Forests and PZU volunteers planted the first 3,000 saplings. The cooperation with State Forest is a response to the fact that PZU’s largest direct environmental impact occurs where it conducts business activity and where its clients and partners operate. This is why the Company decided to carry out a local offsetting of the emissions, which is facilitated by State Forests. The offset of CO2 emissions confirms that PZU implements its strategic declaration and strives towards carbon neutrality. The 2021 emissions are planned to be offset in 2022.
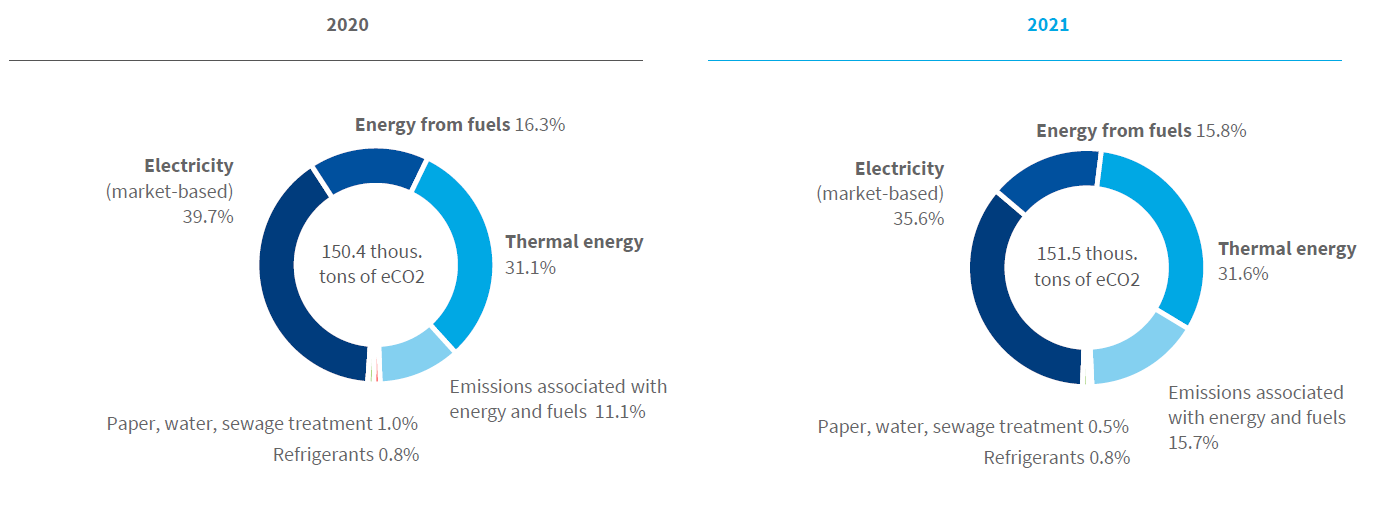
Total CO2 emissions (Scope 1, 2 and 3) in PZU Capital Group by emissions sources
4 Emissions in the base year were not converted for consolidation as the adopted materiality criteria were not satisfied
5 in the accordance with the GHG Protocol methodology https://ghgprotocol.org/
6 For the needs of measuring CO2e emissions, the fuel consumption (liters) was adopted and then CO2e converted to kg
Consumption of raw materials
Curtailing the consumption of raw materials
PZU and PZU Życie systematically reduce the purchase and consumption of office supplies, including paper, constantly reducing the number of printers used. In 2021, only the environment-friendly paper with lower basis weight, i.e. Discovery Eco-Efficient 70 g/m2 holding the “FSC mix” and “EU Ecolabel” certificates – was purchased and used. The change of paper type to a thinner one leads to an over 8% reduction of the weight of the paper consumed, as compared to paper with a standard grammage of 80g/m2. Additionally, the Discovery paper is produced from the Tasmanian Blue Gum eucalyptus tree which, thanks to a different fiber structure, makes it possible to reach a ca. 37% reduction of the wood used in relation to the commonly used trees, such as maritime pine or paper birch. In 2021, 55% of the insurance forms in terms of the weight are prepared on certified paper – this result is for both companies (52% in PZU SA and 61% in PZU Życie). In 2022, the commitment to have at least 50% of the insurance forms in terms of the weight prepared on certified paper, will be continued. All new printing devices have the Blue Angel certificate are equipped with an automatic two-sided printing (duplex) module – wherever the specific nature of work permits two-sided printing, it is set as the default printing option.
PZU strives to increase the volume of electronic mailing. PZU has over 4.3 million mandatory insurance clients who receive renewal correspondence every year. It may be sent in a traditional letter, by e-mail or in the mojePZU application. O At the end of 2021, the number of clients receiving electronic renewal letters from PZU increased by 120 thousand (y/y).
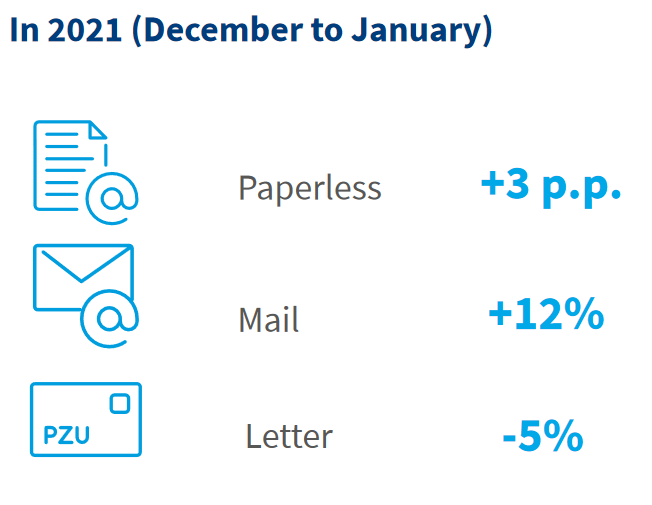
In 2021, almost PLN 1.7 million renewal letters were sent electronically rather than on paper. It is almost 200 thousand more than in 2020. Further curtailment of the consumption of paper in the coming years relies on an increase in the number of mojePZU accounts. A new account of a mandatory insurance client means that the next renewal will be delivered electronically.
Total consumption of raw materials in the PZU Group
| PZU Group | 2020 | 2021 |
| Paper [t] | 1 261 | 850 |
Total consumption of raw materials at PZU and PZU Życie
| PZU | PZU Życie | |||
| 2020 | 2021 | 2020 | 2021 | |
| Paper [t] | 133 | 119 | 71 | 78 |
Paper consumption at PZU and PZU Życie
| Year | Paper in tons | Reduction |
| 2017 | 290,00 | - |
| 2018 | 277,00 | 4,6% |
| 2019 | 276,00 | 0,3% |
| 2020 | 204,00 | 26,1% |
| 2021 | 197,00 | 3,4% |
Phase-out of paper archives
At the end of 2021, PZU branches ceased to print out paper Individual Continuation (IC) insurance policies for archiving in the Central Archive of the PZU Group. The client will still receive a signed policy in the traditional form, but there will be no such document in PZU.
The phase-out of policy printouts has an economic aspect, but the environmental effect is more important. Given the scale of its business, the phase-out of paper archives will save approximately 1,500 trees.
Alior Bank introduced restrictions regarding document printout through optimizing the printing process. The use of company printers is possible only after the employee logs into the device, which prevents incidental printouts and improves the management of paper and toner consumption. Additionally, printers are set by default to double-side printing. The number of branches in the environmentally-friendly format using materials and products from local suppliers increased. Most of such products are recycled. When designing the new facilities, special emphasis was placed on increasing access to daylight to reduce electricity consumption, and the LED lighting provides the ability to adjust the intensity of the lighting to the time of day.
In Q4 2020, Armatura Kraków replaced radiator packaging from full boxes to the so called “sides”. This effort brought savings in the range of 43 tons of paper per year, which is nearly 26% of the annual consumption. In 2021, the company continued to develop this practice, implementing it for additional radiator models. Armatura Kraków regularly carries out activities to reduce waste and consumption of water, energy and gas and its and adverse impact on the environment.
In 2021, Armatura Kraków implemented a central printing system, which improved control and security; it also reduced printing at the company level by approximately 30%. The main features of the implemented system are: improved security through implementation of a card-based authentication, and printouts in any printer connected to the system. Control over printouts through authentication has enabled monitoring and reporting on this area. .
TOW “SOS Service Ukraine” implemented partly electronic document flow to minimize paper consumption. In 2021, 65% of internal documents were moved to the electronic workflow system and 45% of documents exchanged with external partners were moved onto electronic media. Actions were taken to reuse paper and recycle used paper. An agreement was signed with a company which supplies the offices with special boxes for collection and processing of paper.
In addition to reduction of raw material consumption and reduction of greenhouse gas emissions, the PZU Group takes actions reducing the number of printing devices used:
- withdrawal of printers with the least usage;
- printing via shared multi-function devices;
- introduction of printer sharing in the branches where the desk layout allows for that.
Reduction of the number of printers at PZU and PZU Życie
PZU and PZU Życie apply a sustainable and responsible approach to disposal and reuse of assets following the “5 R” principle. This principle encourages us to use resources responsibly, renew and repair older things to extend the time of their operation:
- Reduce;
- Reuse;
- Recycle (segregate and recycle);
- Recover (especially energy from waste);
- Renew.
The companies cooperate with firms offering the highest waste management standards, confirmed by pertinent environmental certificates. PZU and PZU Życie undertook to increase the share of recycling in the total number of liquidated assets from 33% at the end of 2018 to 39% at the end of 2020 (in 2021, this percentage was 34.1% - as a result of the pandemic and the limitation of the asset liquidation process. In 2022, the share of recycling in the total number of liquidated assets should increase again). This ratio is achieved by promoting the sale of assets to employees, external clients or by donating them. Additionally, collections of used mobile phones are held regularly and the devices are sold to a specialized company (recycling).
Reduction of the number of printers at PZU and PZU Życie
| Year | Number of printing devices in use at the end of the calendar year | Reduction |
| 2017 | 5 000 | - |
| 2018 | 4 750 | 5,0% |
| 2019 | 4 600 | 3,2% |
| 2020 | 4 540 | 1,3% |
| 2021 | 4 420 | 2,6% |
The volume of used mobile phones and modems to be recycled and sold to company employees is as follows:
- 2018 – 2,602 pcs.
- 2019 – 2,030 pcs.
- 2020 – over 3,000 pcs.
- 2021 – 1,703 pcs.
In connection with a change of the headquarters, the company plans to sell the assets that will not be moved to other units to employees. We plan to recycle/reuse 85%-90% of furniture at the KBC location (of which 75%-80% to be sold to employees and 25%-20% to be donated) and 50-70% of furniture at the Tower location (50%/50% sales to employees/donations). Employees will also be able to buy white goods, such as coffee makers, refrigerators, dishwashers, microwave ovens, LCD TVs, large format LCD displays/monitors, shredders, projectors, small unregistered items, such as reproductions, small office equipment, lamps, etc.
As part of waste management, the Pekao Bank regularly hands over paper documentation, computer media, furniture, and white and brown goods for specialized disposal. The products are recycled and prepared for reuse as raw materials or alternative fuel. When ordering new white and brown goods, the company takes into account the service involving collection and disposal of old goods.
Curtailing the consumption of water
Water saving activities are associated largely with distribution of potable water. Since 2018, PZU has been implementing a change in the distribution of water in big plastic bottles to a more sustainable system. Installation of water dispensers using water from the water supply system, use of running water filters or consumption of water directly from the tap in places where water is good to drink, not only optimizes the use of water but also reduces the number of plastic bottles on the market, reduces carbon emissions by eliminating transport and reduces the energy and raw materials needed to manufacture plastic bottles.
Total consumption of water separately for PZU and PZU Życie
| PZU | PZU Życie | |||
| 2020 | 2021 | 2020 | 2021 | |
| Water [m3] | 37 483 | 37 397 | 16 201 | 14 311 |
Total consumption of water in the PZU Group
| PZU Group | 2020 | 2021 |
| Water [m3] | 291 322 | 271 704 |
Planned reduction in the number of water dispensers and big water bottles*
| Year (end) | Number of dispensers using big water bottles | Number of big water bottles | Change in the number of dispensers (y/y) |
| 2018 | 1 145 | 4 665 | - |
| 2019 | 916 | 3 732 | -20% |
| 2020 | 733 | 2 986 | -20% |
| 2021 | 738*** | 3 533*** | 0,7% |
| 2022** | 40 | 163 | -95% |
* In PZU locations in which the technical conditions allow for that, running water dispensers are successively installed. In the dispensers water from the water supply system is treated in a multi-level filtration process, after which it can be collected as cold, room temperature or hot water. At the front-office we install dispensers without hot water.
** Due to the COVID-19 situation the agreement on the dispensers operated by EDEN (big plastic water bottles) was extended by eight months till the end of February 2022. This extension will also allow for organizing a single tender procedure for the network dispensers nationwide. A tender procedure for tap water dispensers was commenced in 2021. The procedure has been completed and the agreement for new dispenser has been signed. After the new agreement is implemented, the big bottle dispenser will remain only in the facilities where they cannot be connected to the water system due to technical or ownership reasons.
*** The increase in the number of big bottle dispensers by 5 units from 2020 is due to increased demand for water as employees returned to stationary work and tap dispenser failures. Starting on 1 April 2022, big bottle dispensers will be gradually replaced with tap water dispensers.
Environmental education of employees
The PZU Group is one of the largest employers in Poland. It is aware that building responsible employee attitudes contributes also to reduction of the negative environmental impact. Regular activities are undertaken to encourage employees to save paper by reducing the number of printouts in PZU outlets throughout Poland (back-office): Stickers with the slogan “If you don’t have to, don’t print. Green PZU” encourage the reduction of printouts. The organization also limits printouts of posters and leaflets in internal communication. The promotion of the reduction of printouts will be continued in 2022. The company has planned communication and education campaigns promoting environmentally sound conduct: black and white and double-sided printouts, messages encouraging lower numbers of printouts, e.g.: do not copy – scan, this does not cost anything, use the print view – avoid poor printout formatting, hold paperless meetings – use a projector. Other planned campaigns include an educational campaign encouraging sustainable usage of hybrid and electric cars, posted on the driver’s portal of PZU’s intranet website, and information campaigns on the recycling of used cell phones. Additionally, each issue of the internal employee newsletter “My PZU” contains articles raising key environmental issues.
In 2021 an educational campaign was organized to coincide with the European Sustainability Week. For 5 consecutive days, employees received a dose of knowledge on the Intranet portal. Educational materials were read by more than 1,000 employees. The Sustainability Week was accompanied by a contest entitled “SDG (Sustainable Development Goals) Challenge 2021”, or how PZU may stimulate sustainable development?”, in which employees were encouraged to come up with innovative business ideas. The contest was carried out via the Idea Generator, a platform for the exchange of ideas and comments by PZU Group employees. In this edition of the contest, ideas were sought for business initiatives which would support the execution of three selected Sustainable Development Goals.
- How can PZU prevent climate change and protect natural environment in Poland?
- Protecting and promoting human rights in a digital world - what actions can PZU take?
- “Sustainable Development” - How to engage PZU’s stakeholders in joint actions for sustainable development?
Based on specific criteria, the contest jury selected 10 best ideas, with the winning three receiving financial awards. The best ideas were handed over to business units for in-depth analysis.