Risk vulnerability

Risk pertaining to financial assets
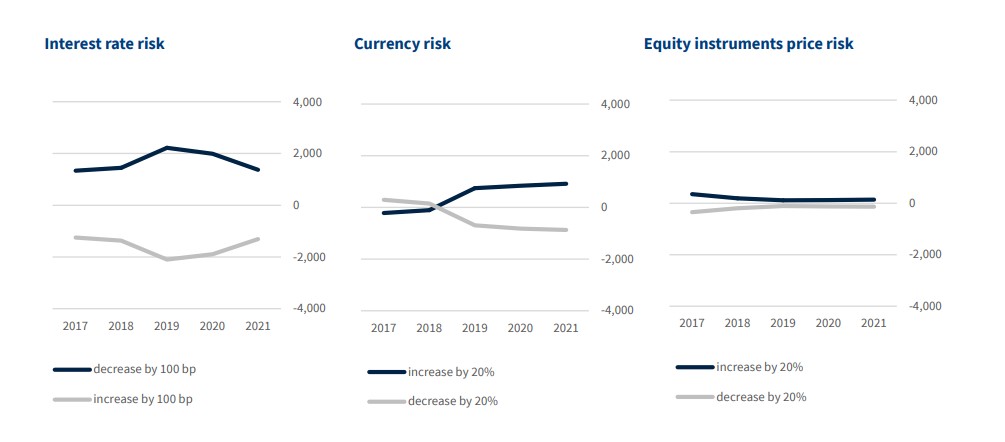
The table below summarizes the results of sensitivity analysis on the value of the investment portfolio to volatility in interest rates, FX rates and the prices of equities. This analysis does not take into account the impact exerted by changing interest rates on the insurance agreements presented in liabilities or the investment contracts and receivables due from bank clients.
Financial assets exposed to exchange risk include the PZU Group’s investment financial assets and financial derivatives denominated in foreign currencies.
Interest rate risk – the possibility of incurring a loss as a result of changes in the value of financial instruments or assets and a change in the present value of projected cash flows from liabilities, caused by changes in the term structure of market rates or in the volatility of risk-free market interest rates;
Foreign exchange risk – the possibility of incurring loss as a result of changes in the value of assets, liabilities and financial instruments, caused by changes in the level or in the volatility of currency exchange rates.
Equity price risk – the possibility of incurring loss as a result of changes in the values of assets, liabilities and financial instruments caused by changes in the level or in the volatility of market prices of equities.
The differences in asset portfolio sensitivity between 2021 and 2021 ensue from the execution of the adopted investment strategy and the adjustment of the investment portfolio to it.
| Sensitivity of the asset portfolio (in PLN m) |
Change of the risk factor | 31 December 2020 | 31 December 2021 |
| Change in portfolio value | Change in portfolio value | ||
| Interest rate risk | decrease by 100 bp | 1 988 | 1 373 |
| increase by 100 bp | -1 897 | -1 313 | |
| Foreign exchange risk | increase by 20% | 838 | 912 |
| decrease by 20% | -819 | -874 | |
| Equity instruments price risk | increase by 20% | 122 | 136 |
| decrease by 20% | -122 | -136 |
The table below presents the contractual level of sensitivity of net interest income (NII) to a 100 bp change in interest rates and sensitivity of the economic value of equity (EVE) of PZU Group’s banks to a 200 bps change in interest rates.
| Entity | Sensitivity in % | 31 December 2020 | 31 December 2021 | ||
| decrease | increase | decrease | increase | ||
| Pekao Bank Group | NII | -6,31% | 1,99% | -7,51% | -1,15% |
| EVE | 2,76% | -7,1% | 3,36% | -6,31% | |
| Alior Bank Group | NII | -13,09% | 1,84% | -7,52% | 0,89% |
| EVE | -0,14% | -1,03% | 0,50% | -2,49% | |
Risk pertaining to technical rates and mortality
The table below presents a sensitivity analysis of the net result and equity to changes in the assumptions used to calculate the provision for the capitalized value of annuities. This analysis does not incorporate the impact exerted by changes in the valuation of deposits used to calculate the provision.
| Impact of the change in assumptions regarding the provision for the capitalized value of annuities in non-life insurance on the net financial result and equity |
31 December 2020 | 31 December 2021 | ||
| gross | net | gross | net | |
| Technical rate - increase by 0.5 p.p. | 457 | 427 | 457 | 425 |
| Technical rate - decrease by 1.0 p.p. | -1 180 | -1 104 | -1 173 | -1 090 |
| Mortality at 110% of the assumed rate | 134 | 129 | 139 | 134 |
| Mortality at 90% of the assumed rate | -151 | -143 | -157 | -149 |
| Impact of the change in assumptions in annuity life insurance on the net financial result and equity | ||
| 31 December 2020 | 31 December 2021 | |
| Technical rate - decrease by 1.0 p.p. | -20 | -18 |
| Mortality at 90% of the assumed rate | -9 | -9 |
| Impact of the change in assumptions in life insurance, excluding provisions in annuity products, on the net financial result and equity | ||
| 31 December 2020 | 31 December 2021 | |
| Technical rate - decrease by 1.0 p.p. | -2 491 | -2 512 |
| Mortality at 110% of the assumed rate | -896 | -886 |
| Morbidity and accident rate – 110% of the assumed rate | -205 | -194 |