Polish banking sector compared to Europe

Since the transformation there has been a significant increase in banking assets in Poland. Measuring the Polish banking sector by the value of assets, it ranks around the European median. According to data of the European Central Bank (ECB), at the end of 2020 the Polish banking sector’s assets totaled EUR 515.3 billion1. The largest banking sector in the European Union is that of France (EUR 8,512 billion at the end of 2020), with Latvia occupying the other end of the spectrum (EUR 24.3 billion at yearend 2020). The assets of European banks (EU-27) at the end of 2020 stood at approx. EUR 35.1 trillion (in the euro area, about EUR 31.5 trillion)2.
In 2020, the ratio of the value of Polish bank assets to the value of GDP increased to 100.5%, which was the highest level in history3, although it is still relatively low compared to European Union countries. The increase in the ratio in Poland was influenced by an increase in banks' exposure to instruments serving to counteract the consequences of the COVID-19 pandemic issued and guaranteed by the State Treasury and the decline in GDP.
The Polish banking sector operates in accordance with the classic model of financial intermediation in which banks mainly provide loans to the non-financial sector using their customers’ deposits in the process. This is reflected in the high share of loans in the banking sector’s assets, which at the end of 2020 accounted for 48% of such assets and was higher than the average for the banking sectors of the European Union (31%). The asset structures of the Polish banking sector and the European Union differ. Poland is characterized by the highest importance of debt securities, including treasury securities, in the balance sheets of Polish banks (in 2020, 29% and 21% share in assets, respectively). In the European Union these shares were on average 8% and 5%4.
At the end of 2020, the value of loans in the Polish banking sector amounted to EUR 298.7 billion, which places Poland in the middle of the European Union countries5.
Loans per capita (2020, EUR) in relation to the insurance market growth rate (2013-2020)
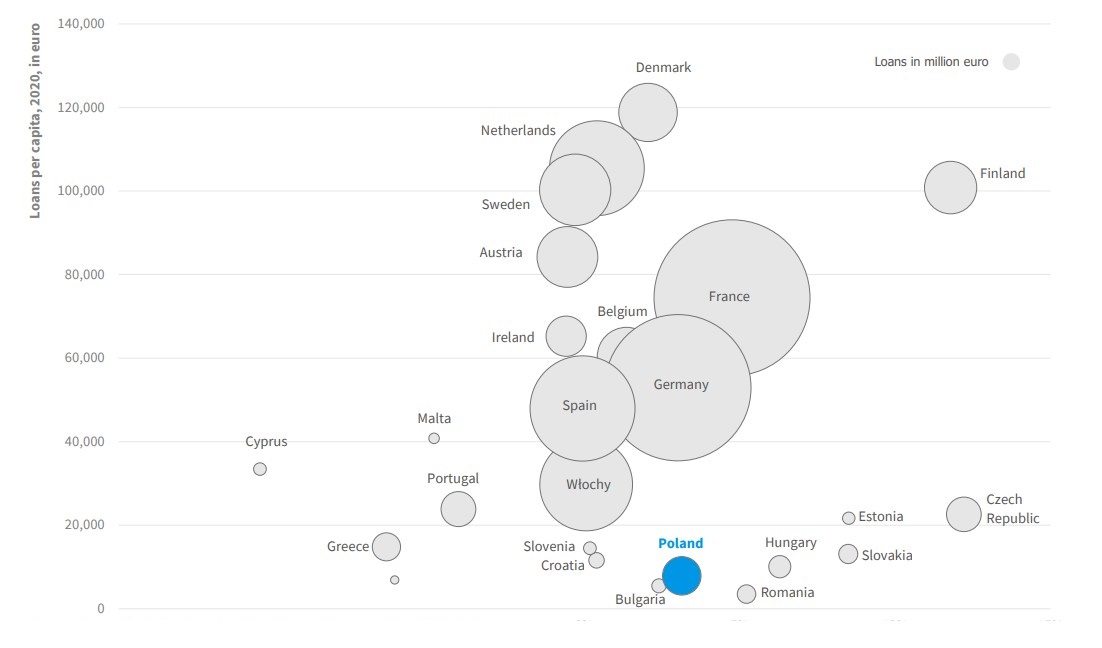
Source: Own calculations based on Eurostat and European Central Bank data
Compared to other European Union states, Poland’s banking sector is small in relation to the country’s GDP. Bank loans in the Polish banking system account for 57% of GDP while the European average is 126%. Finland, the Netherlands, Denmark and Sweden have the highest loans-to-GDP ratios6.
The Polish banking market features a relatively low percentage of business loans in the total value of loans extended to the non-financial sector (32% at yearend 2020)7. The ratio of loans to businesses in the Polish banking sector to GDP (approx. 14%) was one of the lowest in Europe. In 2020, as a result of the pandemic, the gap in the structure of the loan portfolio between Poland and the European Union widened even further. In Poland, the growth rate of business loans gradually decreased, while in the European Union it increased. This was influenced by the different protective measures taken in each country in response to the pandemic. To a large extent, subsidies provided under the PFR Financial Shield were responsible for the limited corporate demand for loans in Poland. In Europe, in turn, government guarantees for bank loans were a popular aid model, which reduced credit risk for banks, thereby stimulating growth in loans8. In turn, the lending activity of banks in Poland focuses on granting loans to households. In 2020, Poland was the second EU country in terms of the share of loans to households in the banking sector's loan portfolio9.
Mortgage loans account for the highest percentage of household loans in Poland (roughly 61%). In the European Union, this proportion is higher and stands at approx. 74% on average10. The lesser significance of mortgage loans in the assets of Polish banks results from the fact that such loans are a relatively new product. For comparison, in 2005 their share in household loans in Poland was approx. 30%, compared to more than 80% in some West European countries11. Mortgage loans in Poland represent only ca. 20% of GDP, while the average in the European Union is 36% of GDP. On the other hand, Poland is one of the EU countries with the highest share of consumer loans in banks' loan portfolios, and the value of consumer loans granted in relation to GDP at the end of 2020 amounted to 13%, which is more than the EU average of 10%12.
In Poland, to a greater extent than the average for the European Union, banks finance their business with deposits from the non-financial sector (including 63% deposits by private individuals). At the end of 2020, they accounted for 61% of the total balance sheet value of the banking sector13. The situation is different in the case of the share of liabilities from the issue of debt securities in the total balance sheet value, which was among the lowest in the European Union. In Poland, excluding BGK's issues for the National Road Fund and the COVID-19 Response Fund, it was 3%, while in the European Union it was approx. 1114.
Share of loans in GDP (2020, %) to GDP per capita (2020, euro)
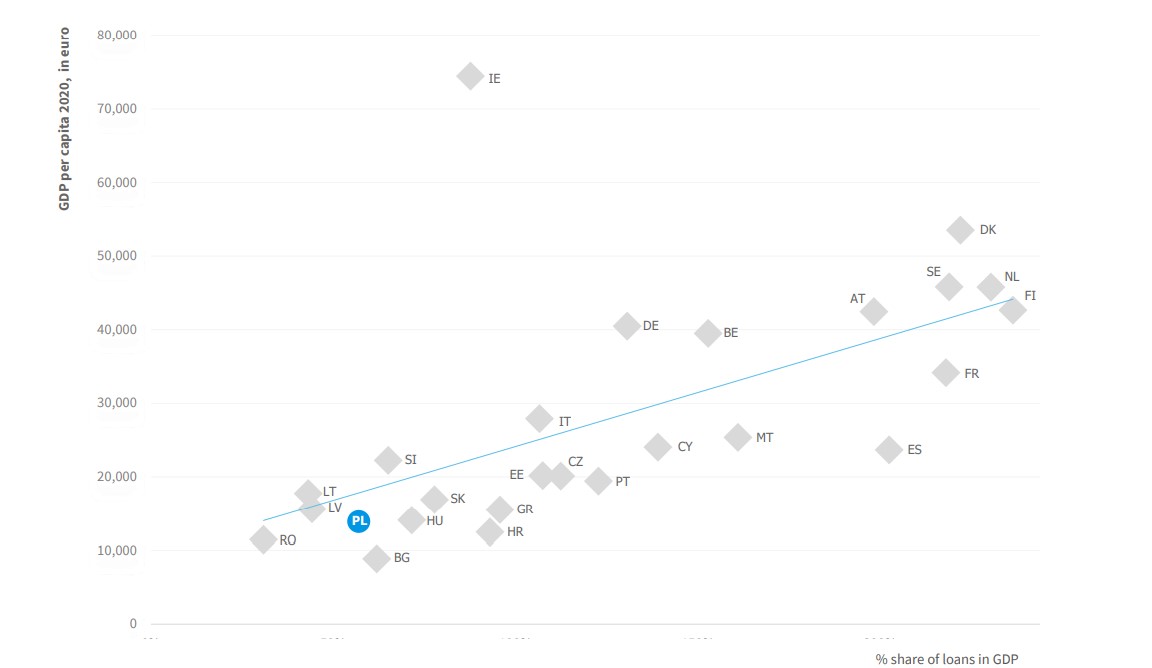
Source: Own calculations based on Eurostat and European Central Bank data
In 2020, despite the COVID-19 pandemic, the financial assets being at the relatively free disposal of households increased by 15.5% y/y to PLN 1,644.5 billion at the end of December, and their ratio to GDP rose to 70.7%. In fear of the economic crisis and the consequences of the restrictions introduced in the fight against the pandemic, households chose more secure ways of investing. There was a high increase in cash in circulation (PLN +81.9 billion), as well as an increase in bank deposits (PLN +95.7 billion), which still remain the most popular form of accumulating financial assets by households. At yearend 2020, deposits in banks and credit unions accounted for 61.0% of the financial assets of households (-2.7 pp y/y), and 81.8% if counted together with their accumulated cash and treasury securities. Financial assets of households in the form of life insurance assets (including unit-linked funds) totaled PLN 62.7 billion in 2020, which accounted for 3.8% of total financial assets of these households (-0.5 pp y/y). Less frequently, households invest their savings in shares listed on the Warsaw Stock Exchange (4.9% of financial assets; +1.0 pp y/y), treasury securities (2.5%; +0.6 pp y/y) and non-treasury securities (0.2%; -0.2 pp y/y)15.
1 As at the date of the report, the most up-to-date data for Europe’s banking market are available for 2020
2 European Central Bank, https://sdw.ecb.europa.eu/
3, 4 National Bank of Poland, “Financial system in Poland 2020”
5, 6 European Central Bank, https://sdw.ecb.europa.eu/
7 National Bank of Poland, “Banking sector financial data”
8, 9,10 National Bank of Poland, “Financial system in Poland 2020”
11 National Bank of Poland, “Financial system in Poland 2019”
12, 14 National Bank of Poland, “Financial system in Poland 2020”
13 National Bank of Poland, “Banking sector financial data”
15 National Bank of Polandi, “Financial system in Poland 2020”