CEO and the Chairman introduce to the most important achievements of the year
Letter to Shareholders
Dear
Shareholders,
On behalf of the PZU Group, I hereby convey to you our activity report for 2021. In the last reporting period, we functioned in highly volatile surroundings. The subsequent waves of the COVID-19 pandemic, the clear recovery in the activity of commercial undertakings and consumers, rising inflation and the suitable shift in monetary policy in the latter half of last year and the economic repercussions of the mounting geopolitical crisis in the last quarter were among the factors contributing to that. In the face of uncertainty shaped by a number of new risk factors, the PZU Group once again demonstrated its capacity to grow its business constantly and steadfastly on all of its critical markets and generate above-average benefits for its shareholders while simultaneously providing clients with an attractive and modern offer and the best service.
Read allVIDEO: Results 2021 - webcast VIDEO: AGM 2021 - webcast

Dear
Sir or Madam,
The PZU Group is the largest financial conglomerate in Poland and Central and Eastern Europe with assets exceeding PLN 400 billion. We have a footprint in five countries in this region. In Poland alone we enjoy the trust of 22 million clients. For us this is a source of great ennoblement but also a great obligation. We are aware to how large of a degree we can influence market standards and social attitudes. We utilize this potential responsibly to co-shape a more sustainable, friendly and safe environment to live and work for all of our stakeholders. We get constructively involved in solving key global and local problems, including ones related to the adverse effects of climate change. We would like to generate significant, recurring benefits for our clients and shareholders by attaching importance not just to financial results but also to how we deliver them.
Read allVIDEO: Results 2021 - webcast VIDEO: AGM 2021 - webcast
Dear Stakeholders,
Last year was a period of strong recovery for the global economy, which was triggered by the improving pandemic situation. Progress in rolling out universal vaccination programs translated into lifting more restrictions applicable to various areas of business activity, and this was of significant importance in rebuilding global supply chains and improving the financial condition of many businesses. In 2021 Poland’s GDP climbed 5.7% year on year, household consumption grew 6.2% y/y and investments moved up 7.9% y/y. Economic growth was underpinned by the strong growth in domestic demand supported by government programs and higher household spending. Households accumulated savings during these health-related restrictions. Consumption was supported by the labor market, which rapidly returned to the level seen prior to the pandemic and robust wage growth. The driver of investments was linked to the solid prospects of economic recovery and the high level of manufacturing capacity utilization.
Read all
PZU in numbers - see what we have accomplished and how we built the value of the PZU Group
PZU in numbers
Discover more Play video
Financial
performance

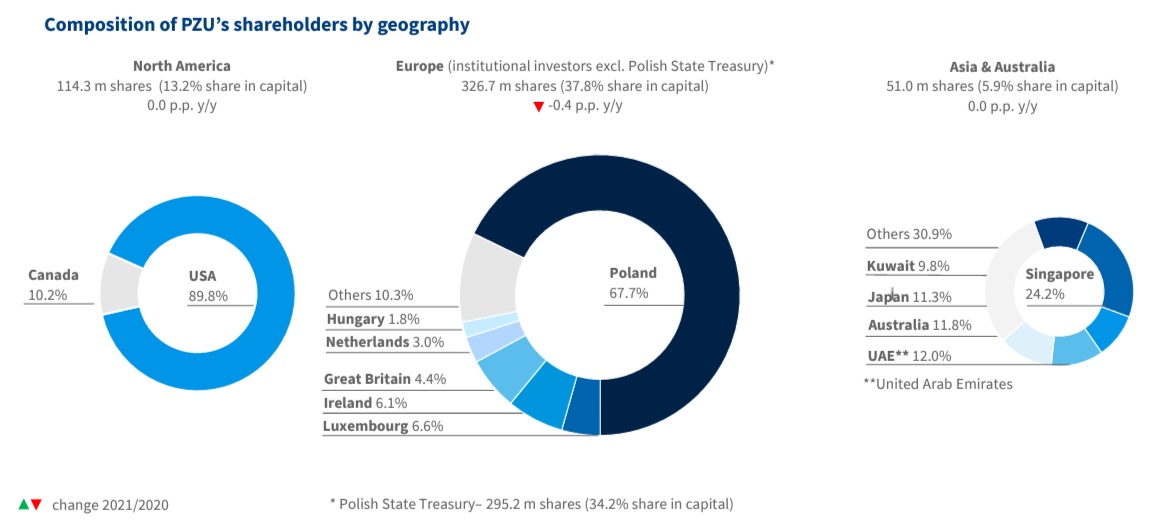
Share
performance

Sustainable
growth

Business
performance
Gross written premium and net profit of PZU since the IPO on the stock exchange
Sales and net profit 2010-2020
Discover more
net
profit
gross written
premium
dividend
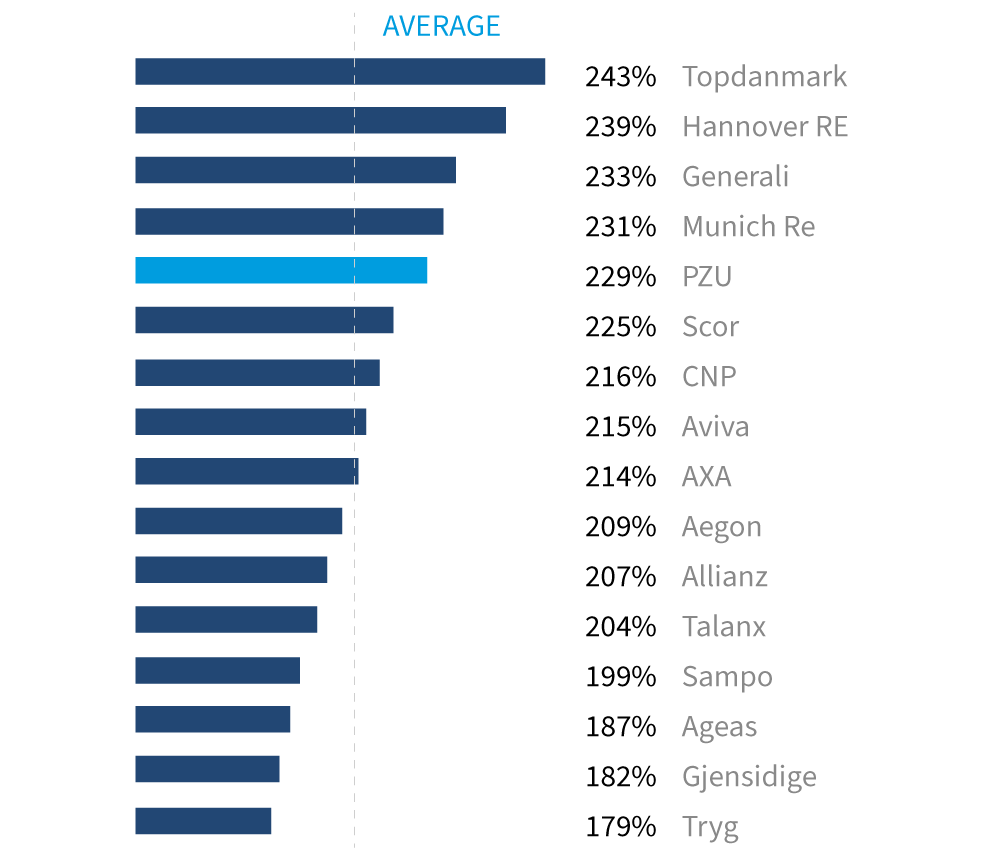
PZU Group’s ROE vs peers
data as of end of Q3 2021
Solvency II
See the implementation of the #nowePZU strategy in 2020 and learn about the key elements of our new Strategy for 2021-2024.
Innovation Strategy
Discover more Play videoGROWTHAND DIVIDENDS
- Higher gross written premium on insurance activity + 9.9% to PLN 26 billion
-
Higher revenue in our health business + 80% to PLN 1.7 billion/
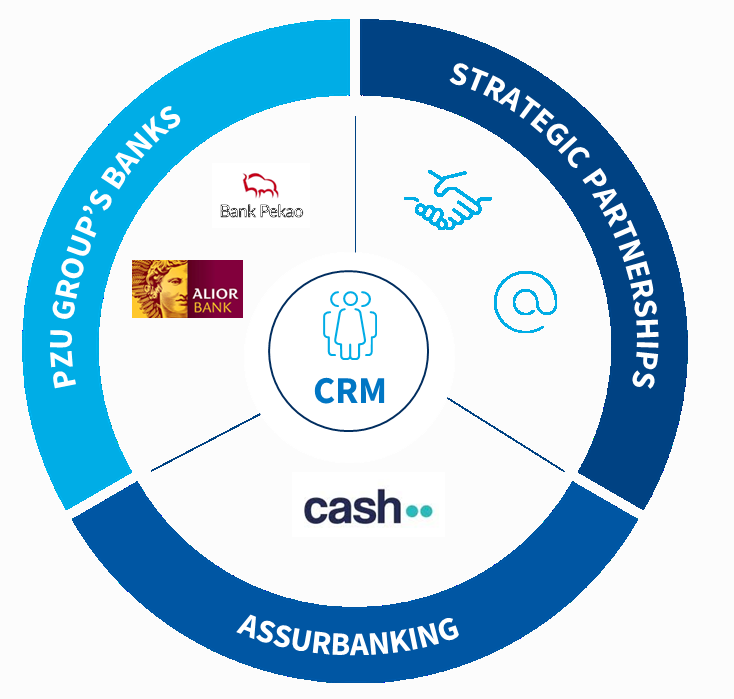
Leader position in asset management – higher AuM + 82% to PLN 60 billion - Leveraging the potential of the PZU Group’s banks – higher contribution of the PZU Group’s banks to the PZU Group’s financial net result + 648% to PLN 0.8 billion
- Maintaining cost effectiveness – 7% administrative expense ratio
- Ensuring a predictable and attractive model for generating shareholder value
SCALEAND SYNERGIES
- Strengthening benefits ensuing from the potential and scale of being the largest insurance and banking group in Central and Eastern Europe
- Giving clients a comprehensive product offering thanks to the synergies afforded by the PZU Group by taking advantage of various distribution channels
- Revolutionizing the approach to health care – comprehensive medical advice
- Developing business ecosystems for new and current clients
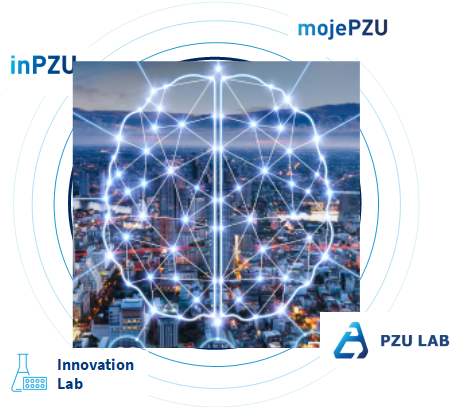
TECHNOLOGYAND DIGITALIZATION
- Digitalization and streamlining processes
- Utilization of AI, Big Data and advanced analytics
- Utilization of new digital distributions channels to supplement the traditional ones
- Implementation of cloud-based solutions
- Introduction of tools for estimating cybersecurity risk in the financial sector
SUSTAINABLEDEVELOPMENT
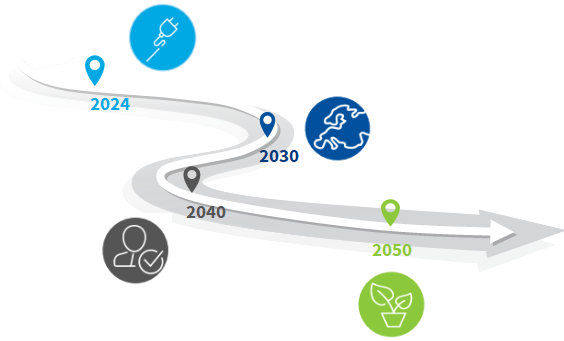
- Achieving climate neutrality (scope 1 and 2) by 2024
- Increasing the exposure in investments supporting climate and energy transformation
- Developing our array of ESG insurance and investment products
- Including ESG criteria in procurement processes
- Including ESG targets among the strategic objectives of our companies and senior management
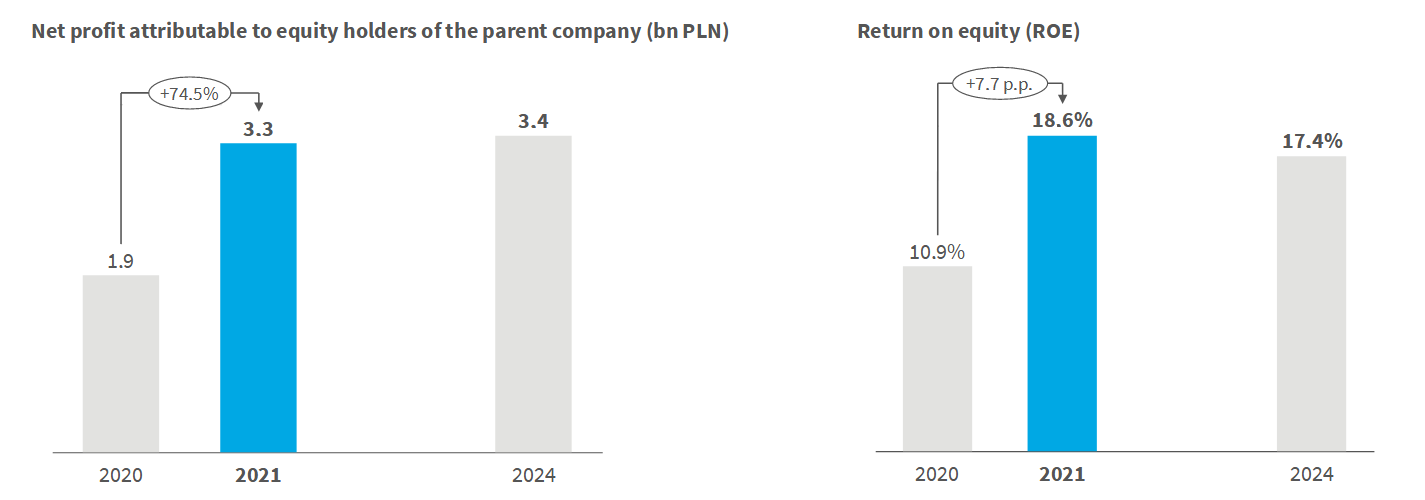
As a result in 2024 we will achieve:
- the highest net profit in PZU’s stock exchange history PLN 3.4 billion
- above average return on equity (ROE) 17.4%
REALIZATION 2021